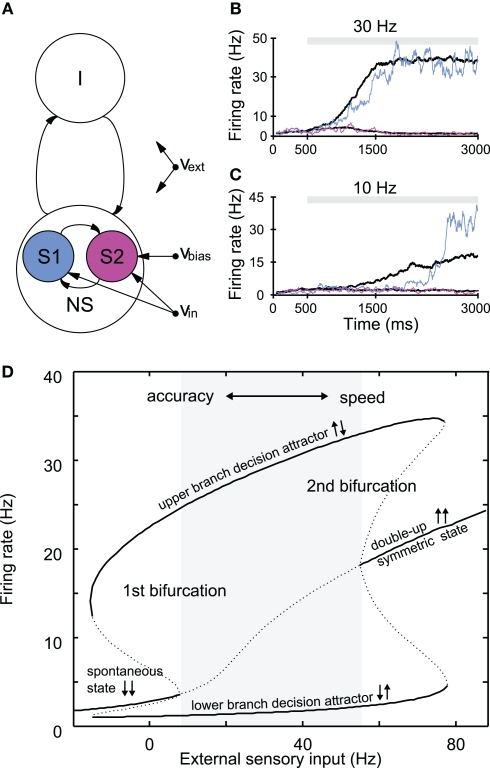
Figure 3.
Attractor network of slow perceptual decision making. (A) Schematic representation of the network, which consists of excitatory and inhibitory spiking neurons, with full synaptic connectivity. All neurons receive external inputs as (poissonian) spike trains characterized by their rate. The excitatory neurons are organized in three pools: the non-specific neurons (NS) and the two selective pools (S1, S2) that receive the inputs encoding each stimulus (with rate νin). An additional bias (νbias) can be applied to one of the two selective pools. All neurons also receive an input (νext) that simulates the spontaneous activity in the surrounding cerebral cortex. (B,C) Single trial (colored traces) and mean firing rate evolution (black) of the selective pools for different inputs. Mean traces are the average over 20 trials for 0% coherence (νbias = 0). (B) In the case of high inputs, the transition from the spontaneous state to the decision state is evidence-driven and slow even for single trials. (C) For low inputs, the switch is induced by noise fluctuations, and rather sharp in a single trial. Yet, the mean activity builds up slowly. (D) Stable (solid lines) and unstable (dotted lines) attractor states, dependent on the external sensory input obtained from a mean-field approximation of the network (Brunel and Wang, 2001). The gray area depicts the evidence-driven regime, where the spontaneous state is no longer stable. Increasing the external inputs to both selective populations increases reaction time and decreases accuracy. Thus, a speed–accuracy trade-off might be implemented through the inputs to the neural populations (see text). Left of the first bifurcation, transitions are induced by noise. (B–D) Simulations were performed with a synaptic strength of 1.68 within selective populations; all other parameters were taken from Wang (2002).

