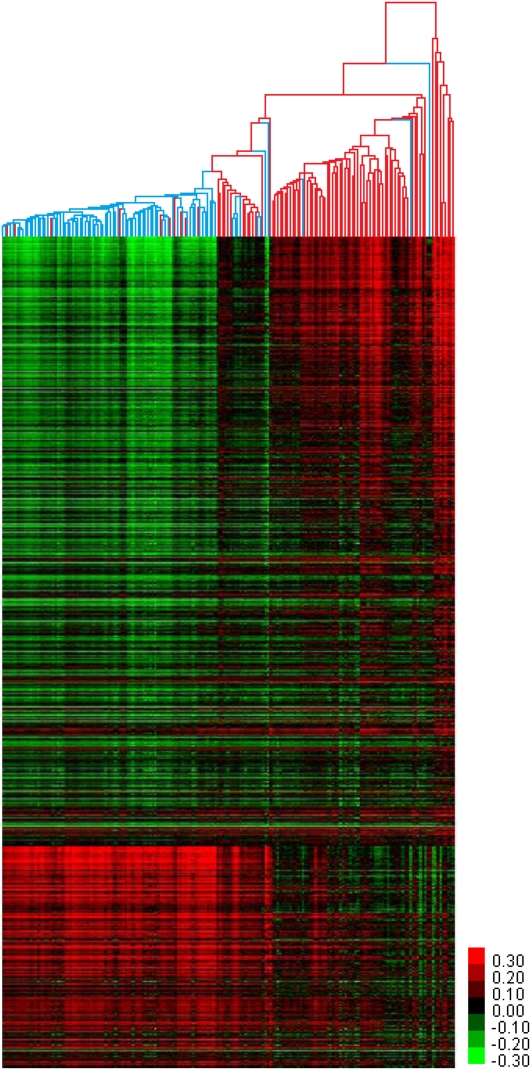
Figure 2.
Differentially methylated CpGs of prostate tumors. Unsupervised hierarchical clustering of 181 prostate tissues based on the 5912 and 2151 CpG sites hypermethylated and hypomethylated in prostate tumors, respectively, as identified by 2-class SAM. (Red branches) Tumor samples; (blue branches) benign adjacent samples; (red pixels) high DNA methylation; (green pixels) low DNA methylation.

