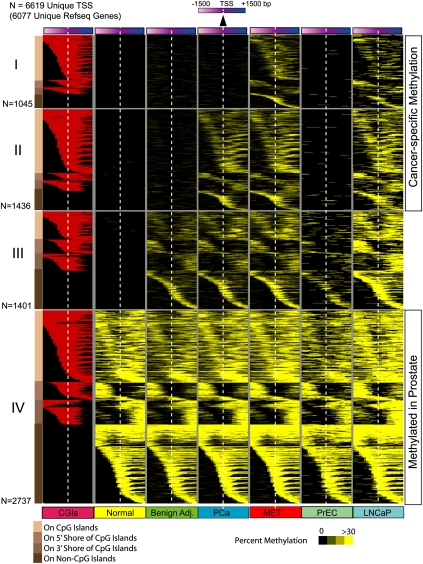
Figure 3.
Promoter DNA methylation during prostate cancer progression. A total of 6619 gene promoters from 6077 unique RefSeq genes harbored DNA methylation (yellow) among the various sample groups analyzed (normal, benign adjacent, PCa, or MET). Promoter methylation percentage in sample groups is represented by varying shades of yellow. Each row represents a unique promoter region at 100-bp window size, covering ±1500 bp flanking the transcription start site, indicated by the white dotted line. The location of a CpG island (red) in methylated gene promoters is shown in the first column. Promoters in group IV (n = 2737) are methylated in all sample groups analyzed, promoters in group III (n = 1401) are methylated in all sample groups except normal tissues, while promoters in groups II (n = 1436) and I (n = 1045) are methylated specifically in cancer samples. Promoters are ordered by the location of methylation on a CpG island, adjacent to the island (shores) or on promoters that lacked CpG islands as represented with different shades of brown on the left for groups I to IV. Methylation patterns in prostate cells PrEC and LNCaP are presented alongside for comparison.

