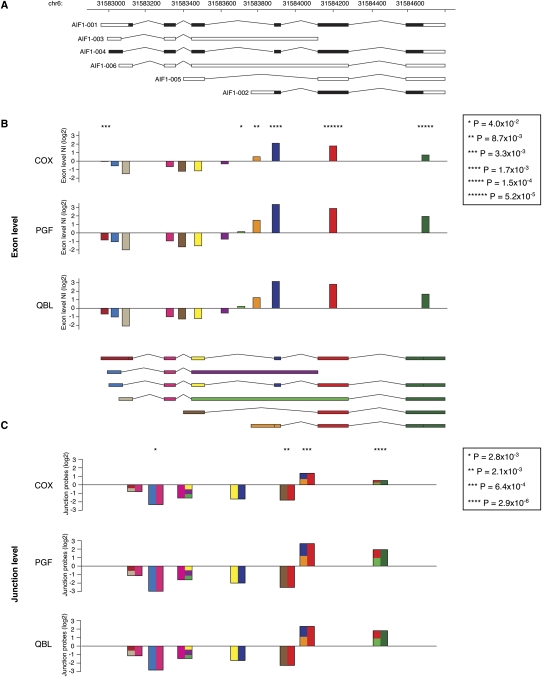
Figure 5.
Variation of splicing events in AIF1 between haplotypes. (A) Gene transcripts as they are annotated in Vega. (B) Barplots of all exon normalized intensities (NI) for each cell line. The color code for each exon is indicated in the transcript scheme underneath. (C) Barplots for the junction normalized intensities (JNI). Donor and acceptor exons are represented on each half of the junction with the same color code as in B. If the junction is shared between different transcripts, the corresponding site is depicted as a composite of all possible exons. (B,C) Asterisks above barplots indicate the level of significance, as listed in the caption, for differential expression between the three cell lines. For example, the isoform AIF1-002 tagged by the exon in orange is proportionally more represented in QBL and PGF than in COX. Conversely, the isoform AIF1-005 characterized by the junction between the brown and the red exons is better represented in COX than in PGF and QBL.

