Figure 2.
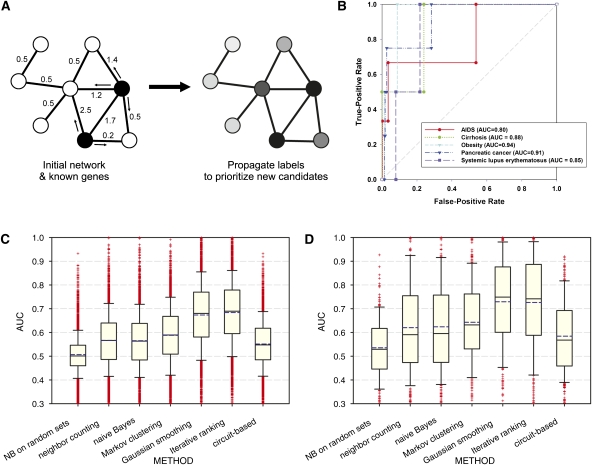
Network-guided prediction of genes for transgenic mouse phenotypes and human diseases. (A) A schematic figure of network-guided prioritization of candidate disease genes. Given some known disease genes (black nodes), additional genes can be predicted by their (weighted) associations in the network, with more strongly connected genes being prioritized more highly (node shading). (B) Known genes associated with several human diseases are well predicted by the Iterative Ranking method for propagating disease labels across HumanNet, as measured using cross-validated ROC analysis. In this and later GBA analyses, we used leave-one-out cross-validation for phenotype sets of 3–10 genes and 10-fold cross-validation for all other sets. The performance can be summarized as the area under the ROC curve (AUC), ranging from 0.5 (random) to 1.0 (perfect). (C) Network GBA predictability of genes associated with 3374 transgenic mouse phenotypes. Bar-and-whiskers plots summarize the predictive performance (measured as cross-validated AUC) for each of six algorithms for using HumanNet to prioritize candidate disease genes. The Iterative Ranking and Gaussian smoothing approaches outperform the others by a significant margin, and show generally high predictability for more than three-quarters of the phenotypes tested. In bar-and-whiskers plots, the central horizontal line in the box indicates the median AUC, and the boundaries of the box indicate the first and third quartiles of the AUC distribution, whiskers indicate the 10th and 90th percentiles, and plus signs indicate individual outliers. The mean AUC is plotted as a dashed blue horizontal line. (D) A related analysis of human disease genes, assembled for 263 diseases from the OMIM database (http://omim.org/), shows similarly strong prediction strengths and the same relative ranking of algorithm performance.

