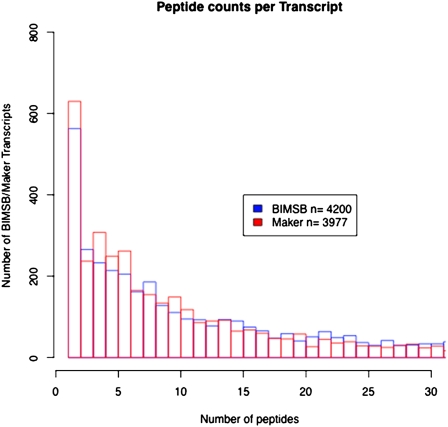
Figure 2.
Distribution of transcripts with different numbers of peptide matches. Distribution of distinct peptide matches to BIMSB ORFs and MAKER-predicted proteins. For each ORF generated from the BIMSB transcript sequences (see main text), the number of distinct peptide mappings is counted (x-axis) and the frequency of each count is plotted (y-axis). The same distribution is shown for the MAKER predicted proteins.

