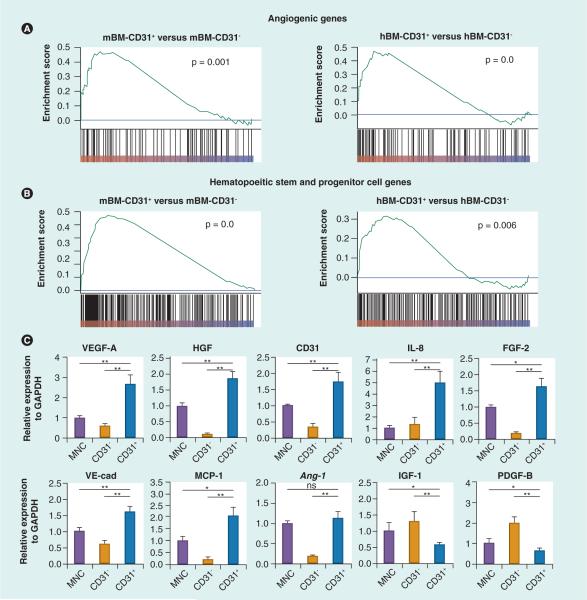
Figure 2. Gene expression patterns in CD31+ and CD31− cells.
Total RNA was isolated from mBM-CD31+, mBM-CD31−, hBM-CD31+, hBM-CD31−, human peripheral blood (hPB)-CD31+, hPB-CD31− cells, and hPB-MNC and subjected to (A & B) microarray and/or (C) real-time reverse transcriptase PCR. (A & B) Gene set enrichment ana lysis was performed using the microarray data. Gene set enrichment ana lysis shows angiogenic genes (A) and hematopoietic stem and progenitor cell genes (B) are globally upregulated in the CD31+ cell fraction; n = 3. (C) The expression patterns of multiple angiogenic factors in hPB-CD31+ and -CD31− cells. Data are presented as a fold difference compared with the mononuclear cell group; n = 6.
*p < 0.05; **p < 0.01.
GAPDH: Glyceraldehyde-3-phosphate dehydrogenase; hBM: Human bone marrow; mBM: Mouse bone marrow; MCP: Monocyte chemoattractant protein; MNC: Mononuclear cell; ns: Not significant; VE-cad: Vascular endothelial cadherin.
(A & B) Reproduced with permission from [101]. (C) Reproduced with permission from [102].

