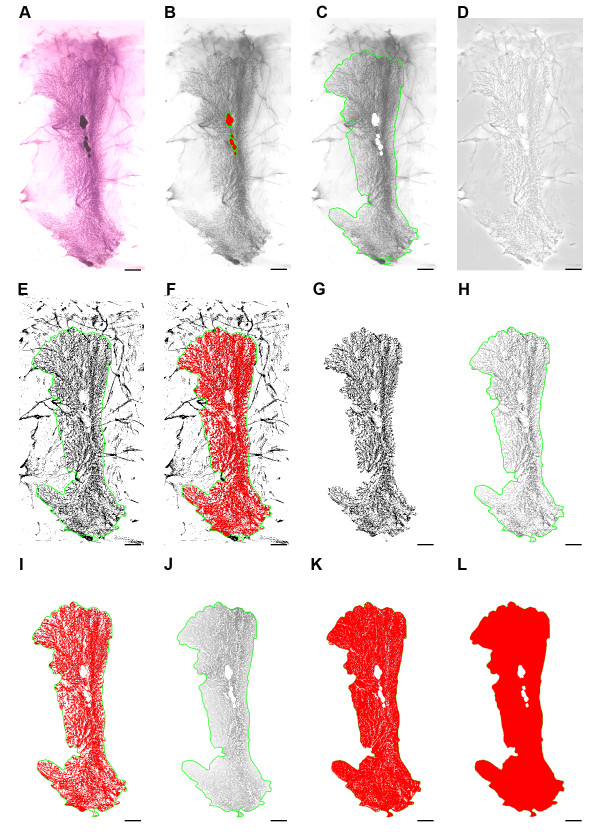
Figure 1.
Stepwise example of whole mount digital image analysis. (A) original color image, (B) image converted to gray scale and lymph nodes marked, (C) lymph nodes excised and epithelia circumscribed as an AOI (green). (D) flattened image, (E) high contrast enhancement applied, (F) setting image threshold, (G) inverted digital mask, (H) extracted epithelia (I) measured epithelia (J) extracted interductal fat pad (K) measured interductal fat pad, (L) total measurement. Bars = 0.5 cm.

