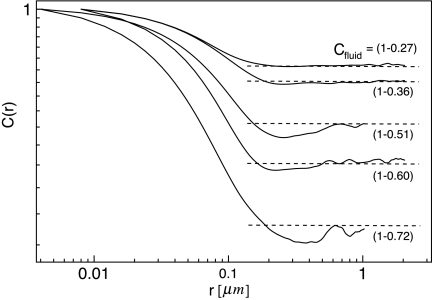
Figure 2.
Pair correlation curves for each obstacle area fraction. All curves are an average from 5 to 8 images. C(r) is calculated up to a maximum of one half the image size. For some compositions this was 4 μm and for the others, adequate images were obtained only for 2 μm scans. Horizontal dashed lines show the average fluid phase area fraction, Cfluid=1−C, and are based on the measurements of obstacle area fraction.

