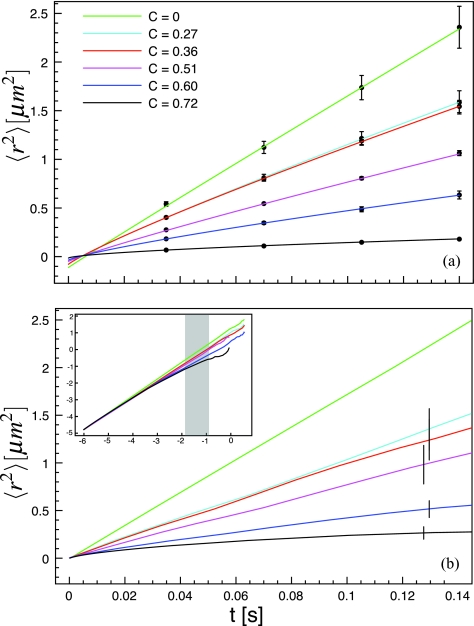
Figure 3.
Ensemble averaged mean-square displacement. (a) The symbols are experimental data and the solid lines are least square fits to Eq. 5. (b) Simulated data, presented on the same timescale as the experimental data. The error bars are the standard deviation between the MSD calculated on different AFM images. The inset is the full log-log representation of the simulated MSD data and the shaded region shows the time range over which the data were fitted with Eq. 2.

