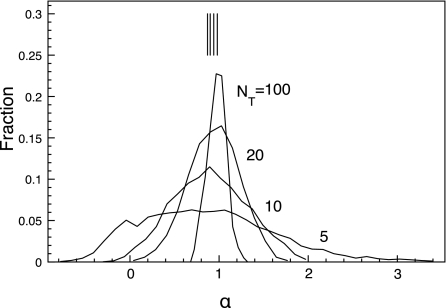
Figure 7.
Distributions of simulated α values for different trajectory lengths for obstacle area fraction C=0.27. α was obtained by a fit of Eq. 2 to the trajectory's MSD up to 5Δt. To match the statistics and timescale of the experiments, here 1Δt = 9000 simulation time steps. NT is the length of trajectories in units of Δt. The vertical lines are the average values, .

