Fig. 2.
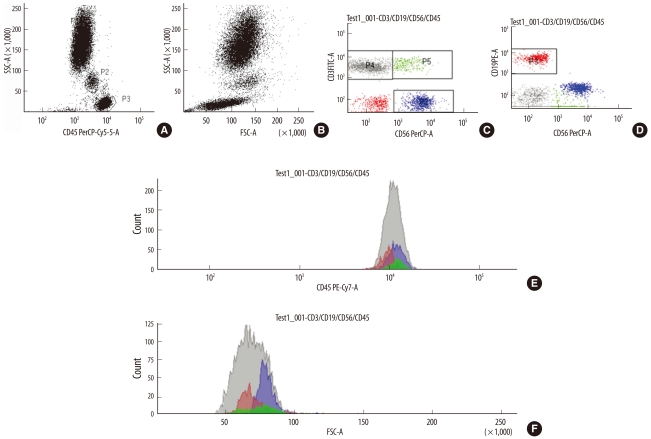
Peripheral blood leukocytes after staining with anti-CD45 showing discrete granulocyte (P1), monocyte (P2), and lymphocyte (P3) populations according to the level of CD45 expression (A) FSC and SSC on the scattergrams (B) The lymphocyte subsets are separated using antibodies to surface antigens. CD3+CD56- T cells (gray) are plotted in the P4 region. CD3+CD56+ NKT cells (green) and CD3-CD56+ NK cells (blue) are plotted in the P5 and P2 regions, respectively (C) CD19+ B cells (red) are plotted in P3 region (D) Evidence for different CD45 expression (E) and FSC levels (F) CD3+CD56+ NKT cells (green) showed the highest CD45 and FSC expression levels. The CD3-CD56+ NK cells (blue) showed high level of FSC also.
Abbreviations: CD, cluster of differentiation; FSC, forward scatter; SSC, side scatter; NKT, natural killer T cell; NK, natural killer cell.

