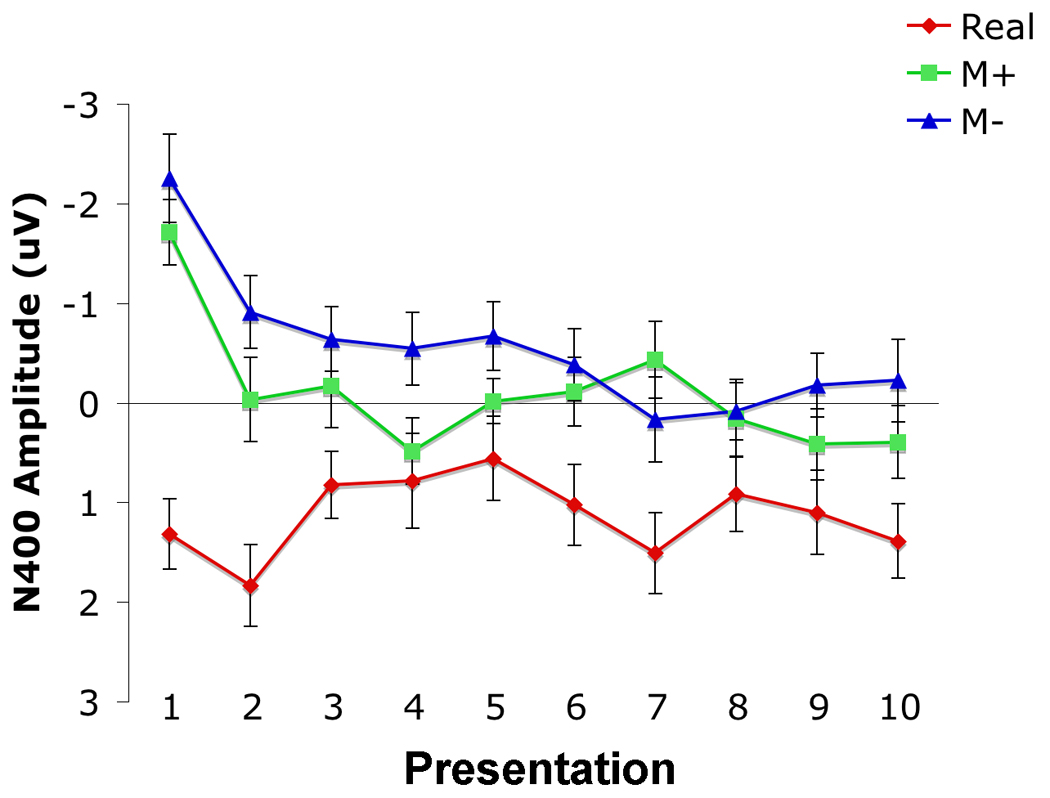
Figure 2.

Mean amplitude plots of the N400 response across all electrodes included in the main factorial ANOVA to real, M+ and M− critical words in the story task, as a function of presentation. Mean amplitude measurements were computed from 300 to 500 msec post-stimulus. Negative is plotted upward. Error bars indicate standard errors of the mean.
