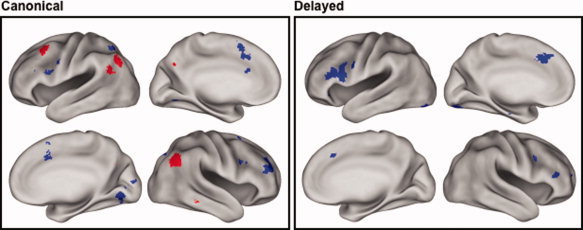
Figure 2.

Regions where old > new and new > old effects varied in magnitude according to task. Left: Effects as identified by analyses employing the canonical HRF. Right: Effects as identified by analyses employing the delayed HRF. Red: Regions where Cued Recall (old > new) > Recognition (old > new). Blue: Regions where Recognition (old > new) > Cued Recall (old > new). Effects are displayed at P < 0.0025 for display purposes. Lateral and medial views of the inflated brain are shown for each hemisphere.
