Figure 4.
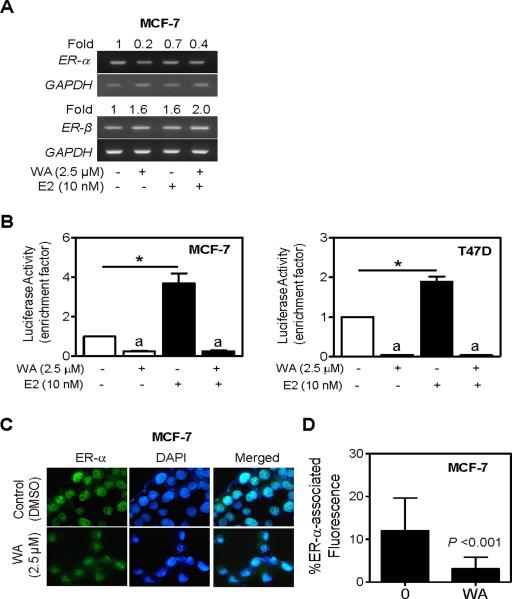
WA treatment suppressed ER-α mRNA expression. (A) RT-PCR for ER-α and ER-β mRNA expression in MCF-7 cells treated for 24 h with 2.5 μM WA in the absence or presence of 10 nM 17β-estradiol (E2). Numbers above bands are indicative of change in mRNA levels relative to DMSO-treated control (first lane). (B) ERE2e1b-associated luciferase reporter activity in MCF-7 (left panel) and T47D cells (right panel) treated for 24 h with 2.5 μM WA in the absence or presence of 10 nM E2. Results shown are mean ± SD (n= 3). Significantly different (P < 0.05) (a) compared with corresponding DMSO-treated control, and (*) between the indicated groups by one-way ANOVA followed by Bonferroni's test. (C) Fluorescence microscopic analysis of ER-α-associated immunofluorescence in MCF-7 cells following 24 h treatment with DMSO or 2.5 μM WA (100× objective magnification). (D) Quantitation of ER-α-associated immunofluorescence in MCF-7 cells treated for 24 h with DMSO or 2.5 μM WA. Combined results from triplicate experiments are shown (mean ± SD, n= 20 for control and n= 33 for WA). Statistical significance was determined by two-tailed t-test.

