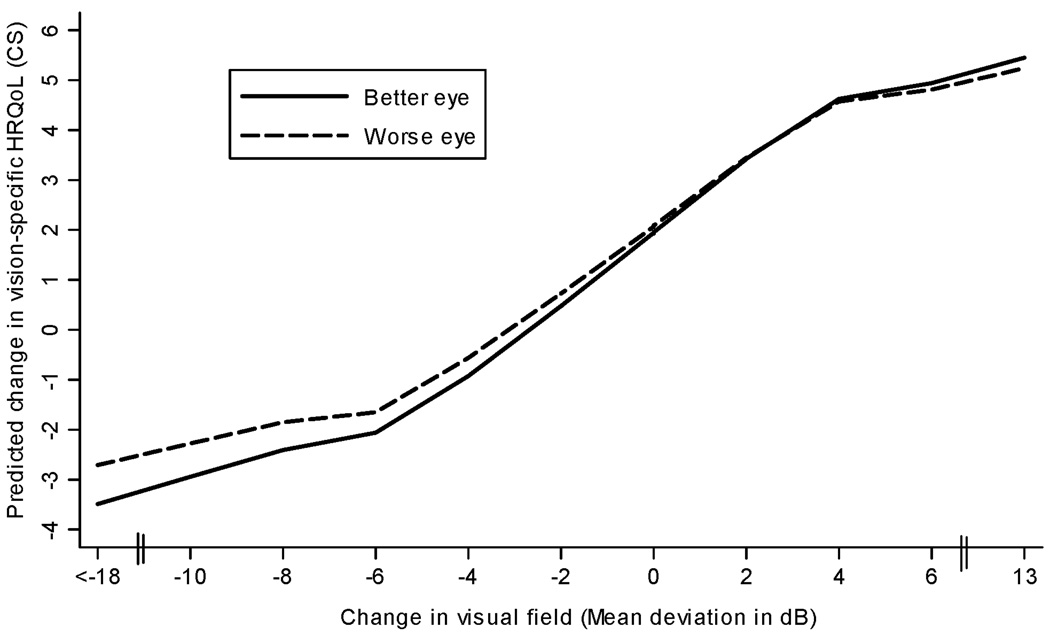
Figure 1.
Locally weighted, least squares plot (LOWESS) depicting the relationship between change in visual field (mean deviation in decibels) and predicted change in vision-specific health related quality of life (HRQoL) in the better and worse seeing eye. Vision-specific HRQoL was measured using the National Eye Institute Visual Function Questionnaire-25 composite score (CS).

