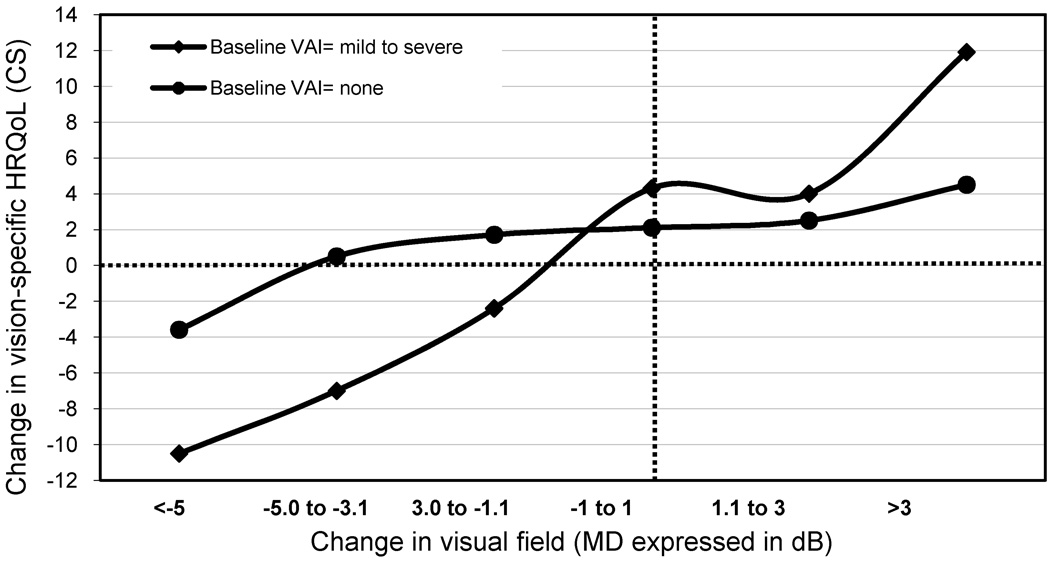
Figure 3.
LOWESS plots depicting the relationship between change in vision-specific health related quality of life (HRQoL) across levels of mean change in visual field [Mean deviation (MD) expressed in decibels (dB)], by severity of impairment in baseline visual acuity (VAI). The figure shows that the effect of change in visual field on vision-specific HRQoL varies by levels of VAI (mild to severe vs. none). The crossing of lines suggests interaction between change in visual field and VAI on their effect in producing a change in vision-specific HRQoL. The intersection of the two broken lines (----) represents the point where there is no change in visual field and no change in vision-specific quality of life.

