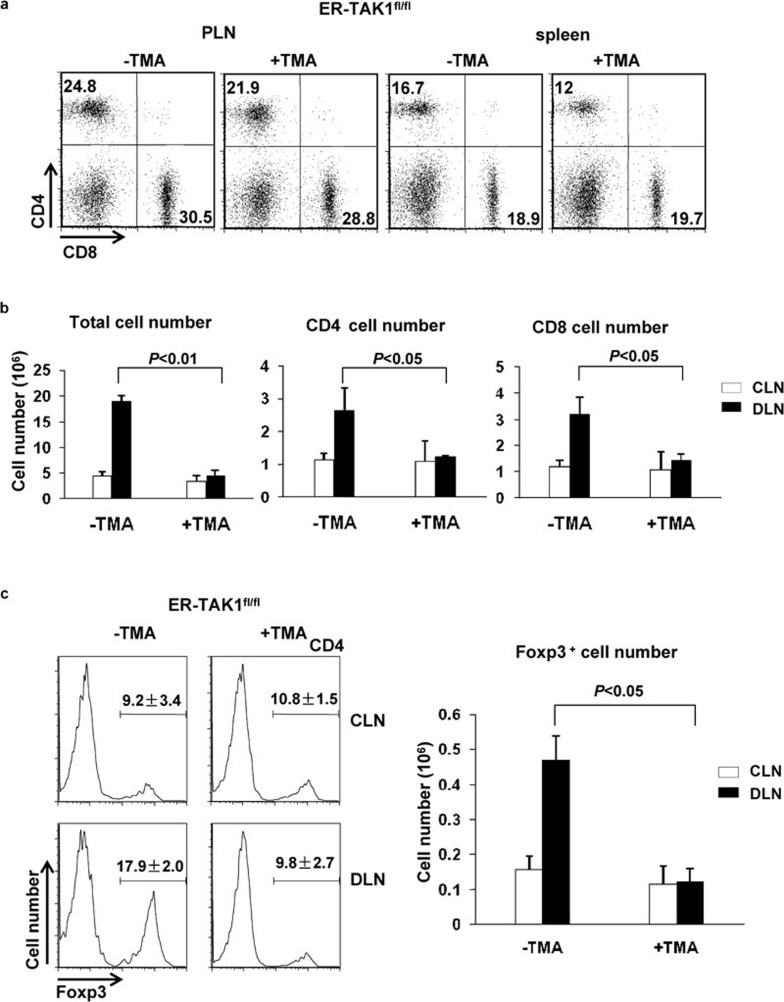
Figure 2.
T cells failed to expand in TMA-treated ER-TAK1fl/fl mice during a CHS response. (a) Flow cytometry analysis of CD4 and CD8 T cells in PLN and spleens from ER-TAK1fl/fl mice with or without TMA treatment. (b) Forty-eight hours after challenge, the auricular lymph nodes of DLN (solid bar) and CLN (open bar) for DNFB-treated ears were collected and the numbers of total lymphocytes were counted and plotted. The numbers of total lymphocytes and CD4 and CD8 T cells were calculated and plotted based on the percentages of each population as determined by flow cytometry analysis. (c) Foxp3 expression was detected by intracellular staining and flow cytometry. Numbers above the bracketed lines indicate the percentage of Foxp3+ cells among the CD4 population (left panel). The absolute numbers of Foxp3+ cells from DLN (solid bar) and CLN (open bar) were calculated and plotted. Mean±SD values of four mice are shown, and the P value is indicated. CHS, contact hypersensitivity; CLN, control lymph node; DLN, draining lymph node; PLN, peripheral lymph node; TAK1, transforming growth factor-β-activated kinase-1; TMA, tamoxifen.

