
Figure 5.
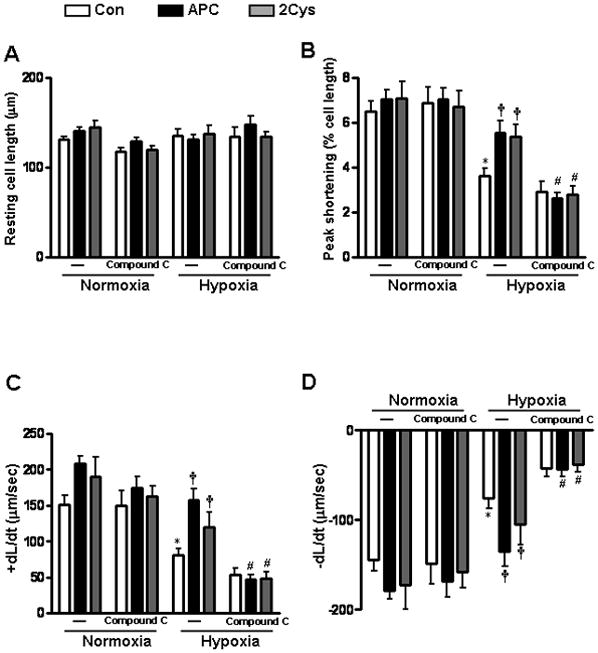
Effect of APC on the contractile properties of cardiomyocytes after exposure to hypoxia. (A) Resting cell length; (B) peak shortening (PS, normalized to cell length); (C) maximal velocity of shortening (+dL/dt) and (D) re-lengthening (-dL/dt) were calculated as described under Methods. Values are means ± S.E., n = 50–100 cells per group, *p<0.01 vs. Con (normoxia), †p<0.05 vs. Con (hypoxia), #p<0.05 vs. APC (hypoxia) or APC-2Cys (hypoxia).