
Figure 1.
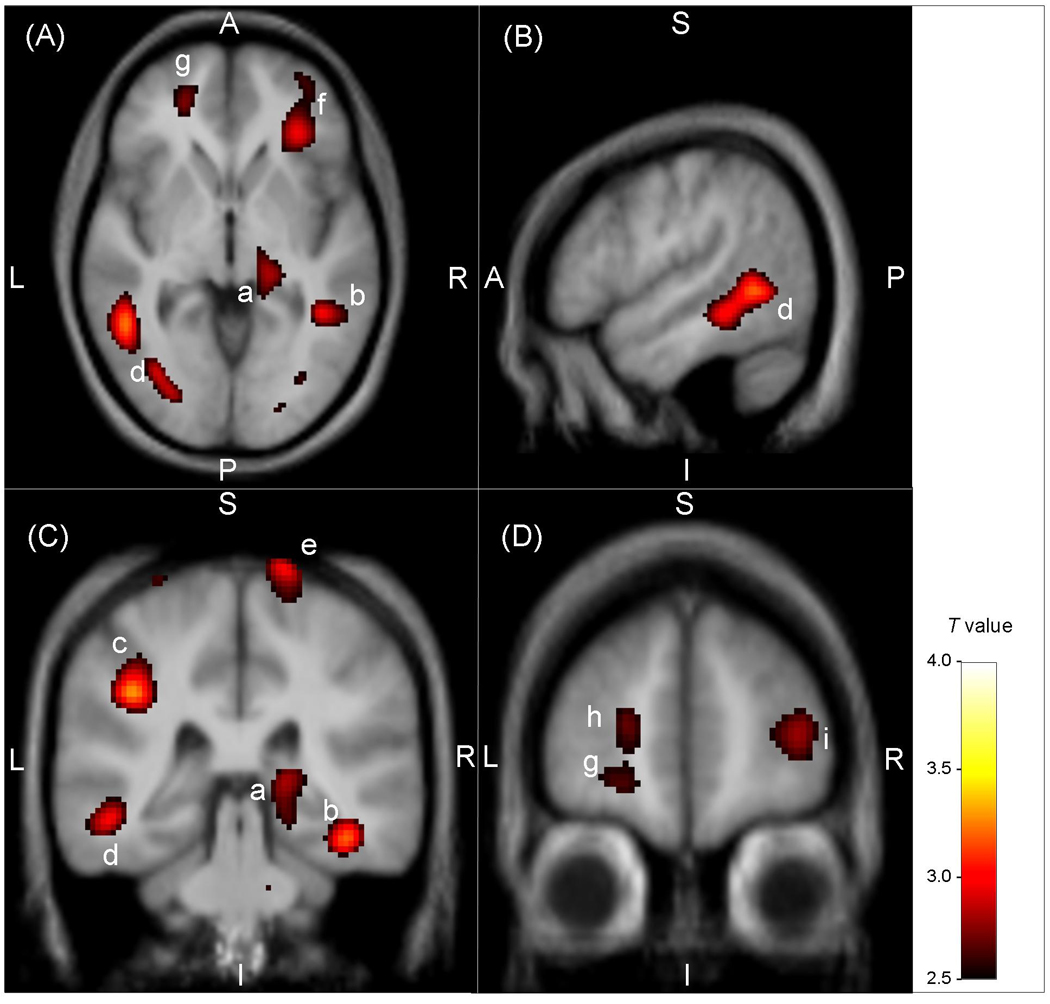
Statistical parametric map illustrating brain regions where the metabotrophic glutamate receptor subtype 5 (mGluR5) density was decreased in subjects with major depressive disorder versus healthy controls. The voxel T values correspond to p < 0.01 for the contrast of DVR between groups and are displayed on axial (A, z: −2), sagittal (B, x: −52) and coronal (C, y: −33; D, y: 51) sections of a spatially normalized and averaged MRI from the study sample. The regions are labelled with the following letters ordered by decreasing t values (Table 1): (a) right mesencephalon / thalamus, (b) right middle / inferior temporal gyrus, (c) left inferior parietal lobe, (d) left middle / inferior temporal gyrus, (e) right precentral gyrus, (f) right anterior insula / inferior prefrontal gyrus, (g) left medial orbital cortex (Brodmann's area 11), (h) left frontal polar cortex (Brodmann's area 10), (i) right lateral prefrontal cortex (Brodmann's area 46). The color bar indicates the voxel T value. Abbreviations: A, anterior; P, posterior; S, superior; I, inferior; L, left; R, right.