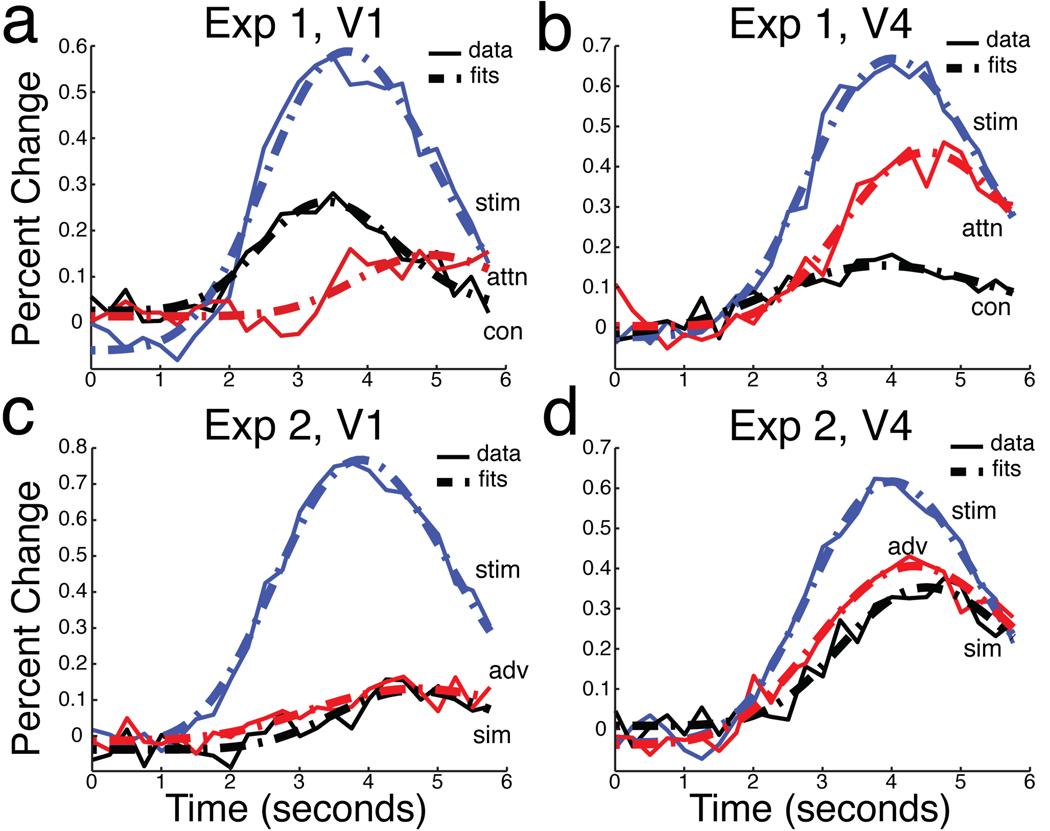
Figure 3.
Response components and fits in Experiments 1 and 2. Estimated HRFs are plotted in solid lines, and the best-fitting gamma functions are plotted in broken lines. In Experiment 1 (a,b), Stimulus-driven (stim) components are plotted in blue; attention-related (attn) components are plotted in red; contrast-related (con) components are plotted in black. In Experiment 2 (c,d), Stimulus-driven (stim) components are plotted in blue; attention-related components are plotted in red for the Advance condition (adv) and in black for the Simultaneous condition (sim).

