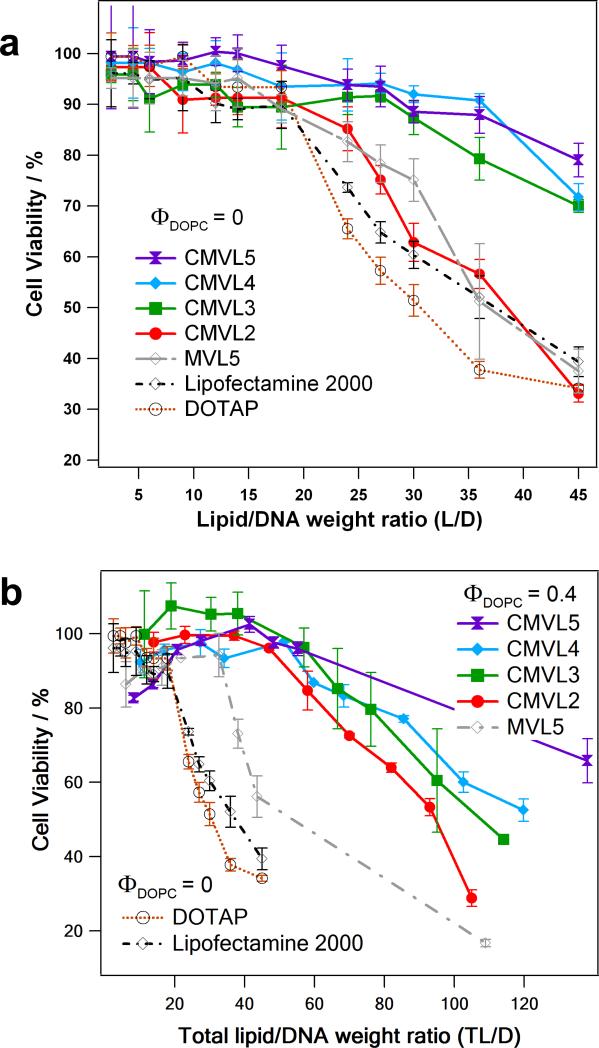
Figure 6.
(a) Cytotoxicity (in mouse L-cells) of CMVL–DNA complexes and other vectors at ΦDOPC = 0. Cell viability is plotted as a function of lipid/DNA weight ratio (L/D). (b) Cytotoxicity of CMVL–DNA complexes and other vectors for optimal or near-optimal (for CMVL2 and CMVL3) formulation (ΦDOPC = 0.4 for MVL5 and the CMVLs; ΦDOPC = 0 for DOTAP and Lipofectamine 2000). Cell viability is plotted as a function of total lipid/DNA weight ratio (TL/D; for DOTAP and Lipofectamine 2000, L/D = TL/D). Note the change in scale for the x-axis. For both plots, error bars show the standard deviation of quadruplicate measurements.

