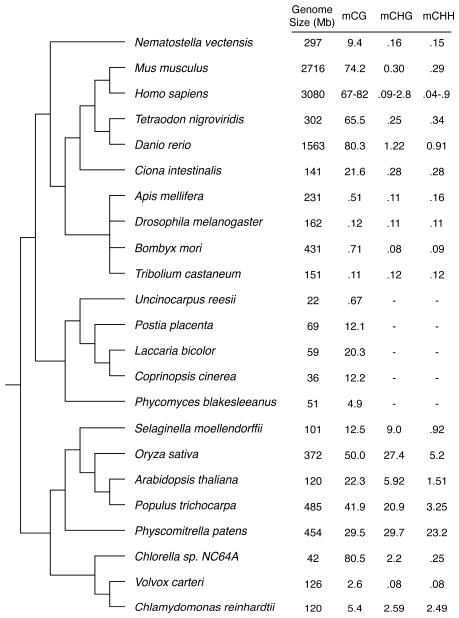
Fig. 1.
Methylation levels in 23 eukaryotic organisms. The organisms are organized according to their evolutionary distance. Tree topology is determined from the NCBI Taxonomy (http://www.ncbi.nlm.nih.gov/guide/taxonomy/) and displayed using TreeView X (http://darwin.zoology.gla.ac.uk/~rpage/treeviewx/index.html). The genome size is indicated together with the percentage of methylated sites within three sequence contexts: CpG, CHG and CHH (H being A, C or T).

