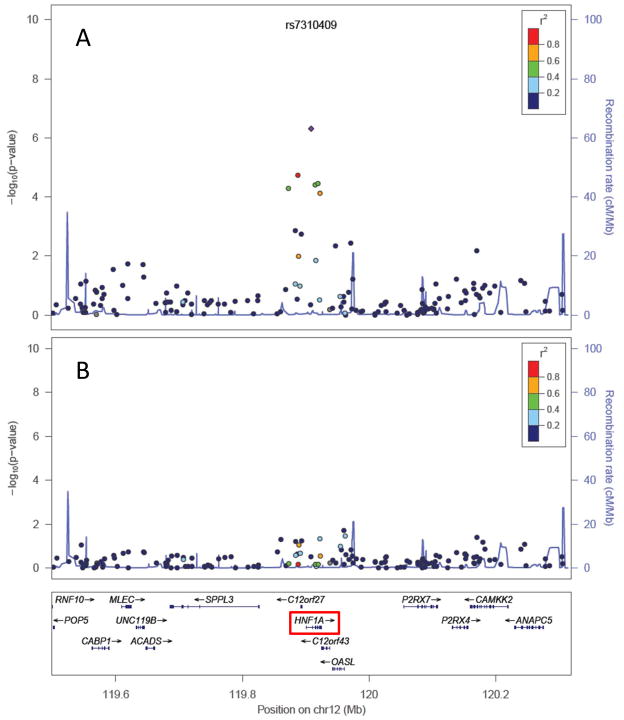
Figure 2. Association results for all genotyped SNPs in the HNF1A region (PanScan I+II data).
P-values for each SNP are plotted both before (Panel A) and after (Panel B) adjusting each logistic regression for lead SNP rs7310409. Color coding of plotted P-values represents correlation with rs7310409 (in HapMap CEU population). This figure includes all genotyped SNPs, including SNPs not contained in the NHGRI’s GWA study catalog.

