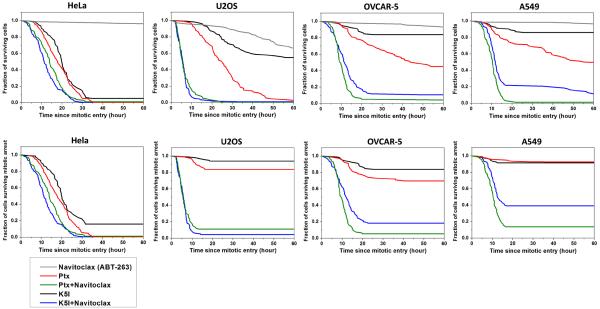
Figure 2.
Cumulative survival curves for indicated treatments in four cancer cell lines: treatment with 1μM Navitoclax (ABT-263) alone (denoted in gray), 150 nM paclitaxel alone (red), 150nM paclitaxel + 1μM Navitoclax (green), 1μM K5I alone (black) and 1μM K5I + 1μM Navitoclax (blue). Total number of cells analyzed for each curve ranges from 76 to 120, varied between conditions and cell lines. Individual cells were monitored by phase-contrast and fluorescence time-lapse microscopy, and time from mitotic entry to morphological death was measured and plotted as cumulative survival curves. The upper panel quantified kinetics of all cell death and the lower panel quantified only death during mitotic arrest.

