
Figure 3.
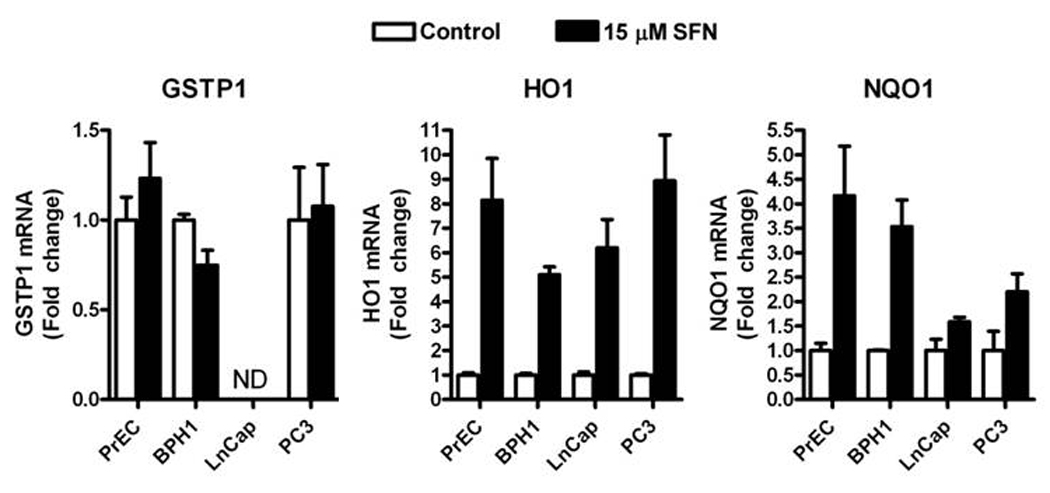
SFN increases the level of HO1 and NQO1 mRNA in PrEC, BPH1, LnCap and PC3 cells. Cells were treated with DMSO (control) (white bars) or 15 µM SFN (black bars) for 12 h and harvested for qRT-PCR. GSTP1 (left), HO1 (middle) and NQO1 (right). Data in bar graphs represent mean ± SEM (n=3). ND=none detected. Data were analyzed by 1-way ANOVA and Dunnett’s post-test.