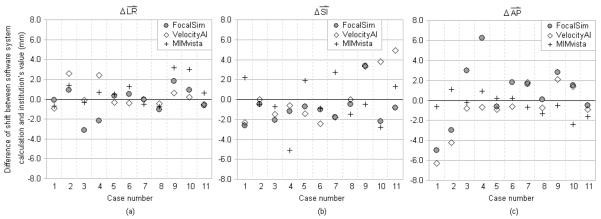
Fig. 2.
Difference of registration shifts between the software system calculations and the submitted clinical values for prostate cases. X-axis represents different cases. The symbols with same X coordinate are for the same image dataset (case) calculated by different software systems. Cases 1-4 are from TomoTherapy CTrue. Cases 5-8 are from Elekta XVI. Cases 9-11 are from Varian OBI. Y-axis represents the magnitude of the differences. (a) Comparison in left-right dimension. To the patient’s left is positive direction. (b) Comparison in superior-inferior dimension. To the patient’s superior is positive direction. (c) Comparison in anterior-posterior dimension. To the patient’s anterior is positive direction.

