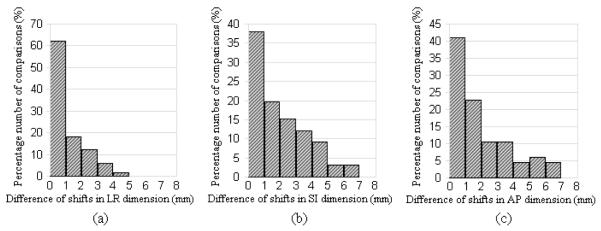
Fig. 4.
The histogram of the distributions of registration differences from the 66 complete comparisons for prostate cases (bin size=1mm). X-axis represents the absolute value of difference of registration shifts in (a) LR dimension, (b) SI dimension, and (c) AP dimension. Y-axis represents the normalized percentage number of comparisons.

