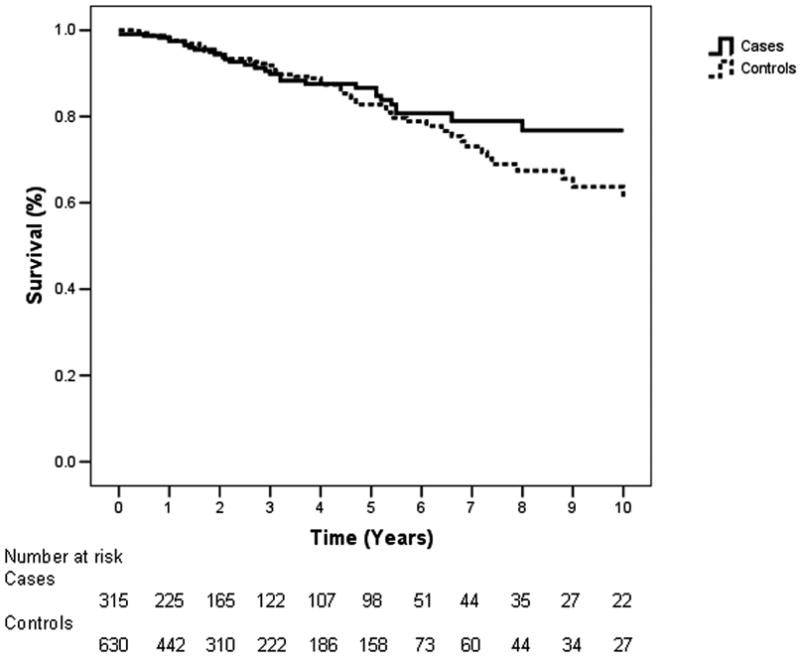
Figure 1.

Kaplan-Meier 10-year survival curves of 315 Cases and 630 controls. There was no significant difference between the survival curves (p=0.33). The number at risk refers to the number of individuals remaining at a given time after deaths and censored individuals have been subtracted.
