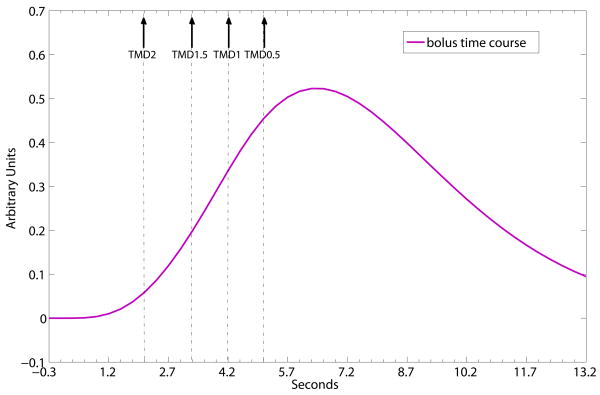
Fig. 1.
Schematic representation of a simulated bolus time course and the time to reach the maximum peaks of its fractional derivatives, demonstrating the time relation of TMD0.5 > TMD1 > TMD1.5 > TMD2. Solid arrows point to the time locations of TMD2, TMD1.5, TMD1 and TMD0.5 on the schematic time course.

