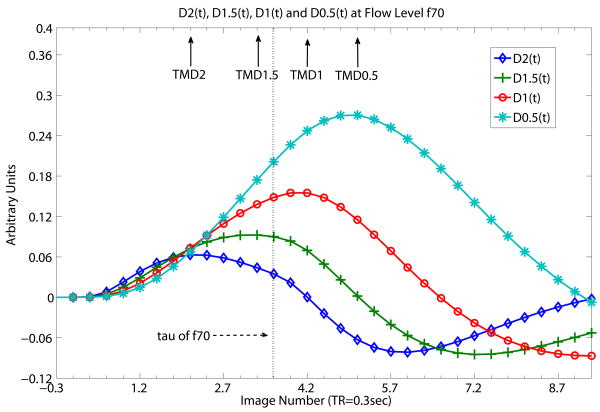
Fig. 2.
Time courses D2(t), D1.5(t), D1(t) and D0.5(t) at flow level of f70 (70ml/100mg/min) of simulated flow data. Fig 2 shows what TMDX of C(t) is like with ‘same f, different D’ (same flow level, different derivative orders of DX(t)). At flow level f70, the time to reach the maximum peaks of the higher orders of derivatives (TMD2 and TMD1.5) are shorter than τ, the tissue mean transit time of f70, whereas the time to reach the maximum peaks of the lower order of derivatives (TMD1, TMD0.5) are longer than τ. τ is spelt “tau” in Fig. 2 as well as in the following Fig. 3 and 4. Solid arrows indicate the time locations of TMD2, TMD1.5, TMD1 and TMD0.5. Dotted vertical line indicated by dashed arrow shows where τ (spelt as tau) of f70 is. Whether a particular TMDX is longer than τ, thereby violating ET's basic assumption, depends of course on the length of τ and on the shape of the time course which in turns depends on the bolus injection rate and other external factors. TOA is known for simulation data so proper correction of bolus transit delay for all the time courses have already been made for all DX(t). The unit of the x-axis is in seconds with data point separation at 0.3sec. The starting time point 0 is the known TOA.

