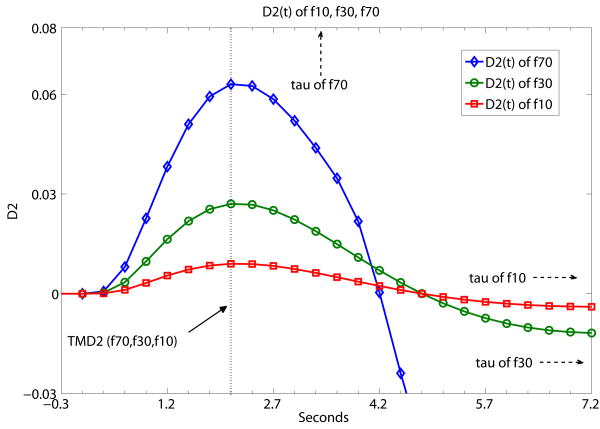
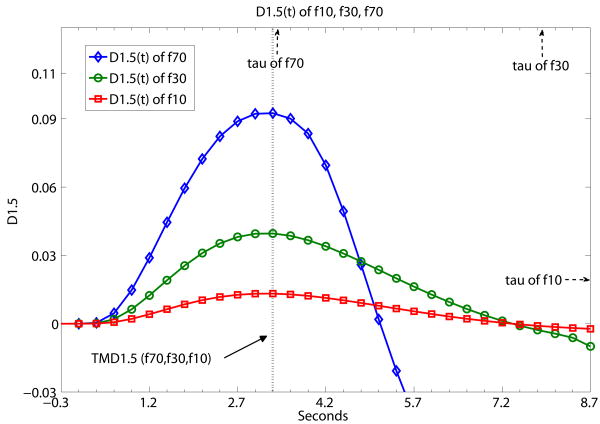
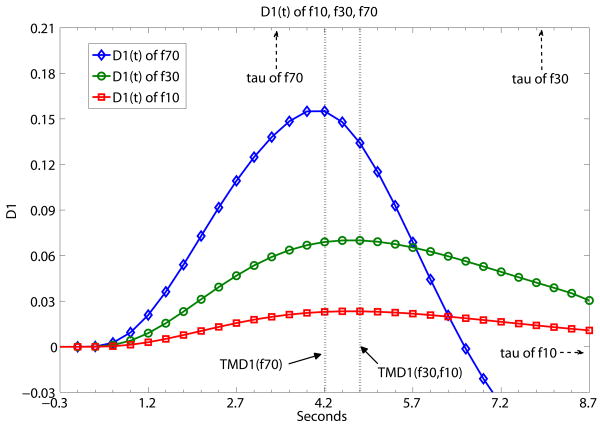
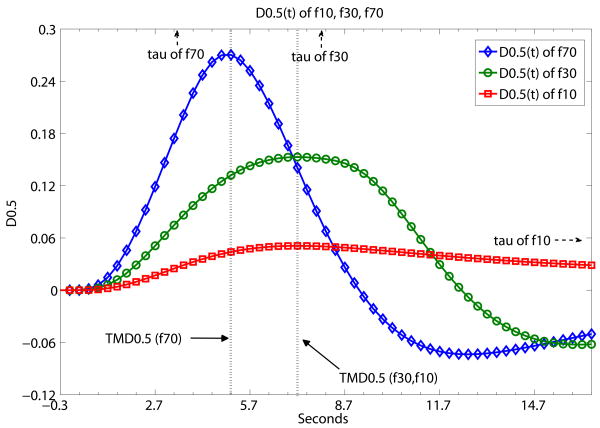
Fig. 3.
A demonstration that TMDX is independent of flow levels as long as TMDX is shorter than the tissue mean transit time τ of the particular flow level. Otherwise, TMDX could attain different values for different flow levels. Fig. 3 shows what TMDX is like with ‘same D, different f’ (same derivative order of DX(t), different flow levels). D2(t), D1.5(t), D1(t) and D0.5(t) of simulated flow data are presented separately at (a), (b), (c), (d) below at the different flow levels of f10, f30 and f70. The unit of the x-axis is in seconds with data point separation at 0.3sec. The starting time point 0 is the known TOA. (a) the maximum values of D2(t), namely TMD2, are the same for f10, f30 and f70. TMD2 < τ's of all three flow levels. (b) the maximum values of D1.5(t), namely TMD1.5, are again the same for f10, f30 and f70. TMD1.5 < τ's of all three flow levels. (c) the maximum values of D1(t), namely TMD1, are the same for f10 and f30. TMD1 < τ's of f10 and f30. But TMD1 is of a different value for f70. TMD1 > τ of f70. (d) the maximum values of D0.5(t), namely TMD0.5, are the same for f10 and f30. TMD0.5 < τ's of f10 and f30. But TMD0.5 is of a different value for f70. TMD0.5 > τ of f70.


