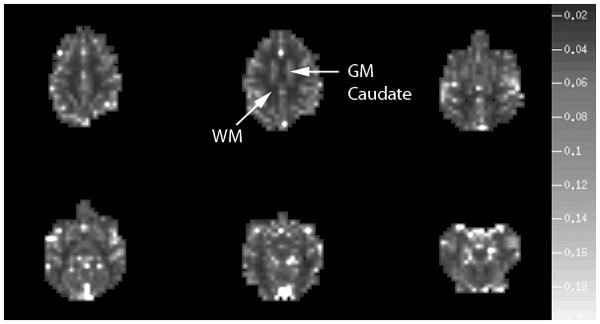
Fig. 5.

Map of MD1.5 values taken to represent rCBF map for six brain slices from one of the monkey imaging sessions and demonstrates good gray white matter flow contrast. The grayscale on the right represents the values of MD1.5. As described in the Results Section of the manuscript, the flow ratio values given by the selected gray and white regions of interest are consistent with literature values. Upper arrow points to the caudate gray matter ROI and the lower arrow points to the deep white matter ROI used for flow ratio calculation. The caudate ROI was chosen for its relative uniformity and size.
