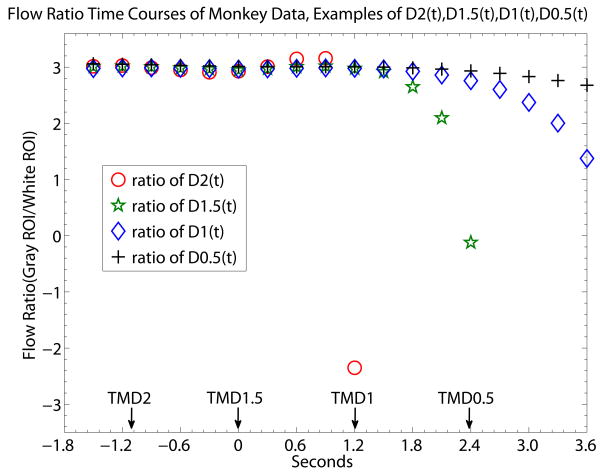
Fig. 6.
Gray/white brain tissue flow ratio time courses generated by ratio of D2(t), D1.5(t), D1(t) and D0.5(t). The monkey brain flow ratio time courses presented here are analogous t the flow ratio of simulation data of Fig. 4. The reference rTOA of TMD1.5 is used for all the time courses of DX(t) to correct the bolus transit delay. The unit of the x-axis is in seconds with data point separation at 0.3sec. The starting time point 0 is set to be the time location of TMD1.5 since we did not look for TOA. The gray-white flow ratio values reach a steady state level at the early time points of the bolus data. At the end of the steady state level of flow ratio, D2(t) shows the sharpest deviation from the steady state level while D0.5(t) shows the slowest rate of drop of flow ratio signal from the steady state. Unlike the simulation data of Fig. 4, the time location of experimental “τ” is not sharply definable in the monkey data, likely due to the noise of the individual experimental time courses of DX(t). TMD2 occurs at the time when the gray/white flow ratio is at a steady state. So is the case with TMD1.5 while it may be more approximate for TMD1 and TMD0.5. What can be expected is that the lower the order of the derivative, the larger chance is for MDX to be different from the value of the steady state flow ratio. On the other hand, the lower the order of the derivative, the smaller is the rate of the flow ratio value dropping off from a steady state level. If indentifying experimental “τ” is a priority, TMD2 and TMD1.5 could provide better information. Given another priority, if the experimental data is seriously constrained by low CNR, TMD1 and TMD0.5 could be considered. In that case, even if there is a chance of missing ET's basic assumption, D1((t) and D0.5(t) drops from the steady state level at a relatively slow rate.

