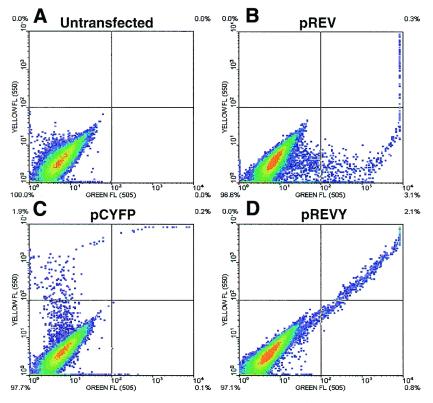
Figure 2.
FACS analyses of LNCaP cells 24 h post-transfection with various fluorescent protein-expressing vectors. Cells were transfected with 5 µg of DNA. (A) Untransfected cells; (B–D) cells transfected with pREV, pCYFP and the pREVY vector, respectively. The angle of yellow/green fluorescence slope (D) shows that both EGFP and EYFP are expressed at very similar levels within cells transfected with the pREVY vector.

