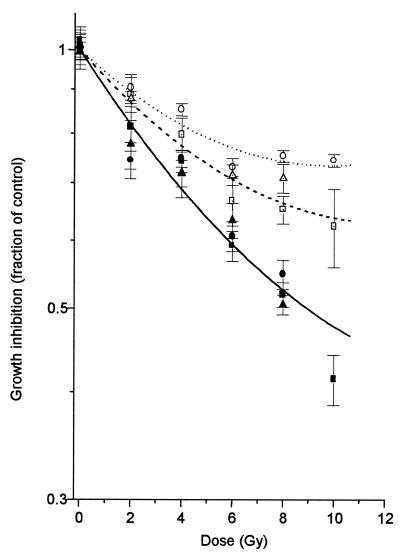
Figure 4.
MTT growth inhibition curves. Each point represents 24 measurements; eight repeats per cell line per plate and three plates for each dose. Growth inhibition was calculated as irradiated:unirradiated mean cell growth for each cell line. A linear quadratic fit was used to produce all the curves. Common α and β parameters were fitted for different experiments, with cell lines of the same individual type, i.e. LNCaP, empty vector or ribozyme-transfected cells, and a common β parameter of –0.0034 (±0.0007) Gy–2 was fitted for all curves. Open circles, LNCaP; open triangles, V4; open squares, V19; closed squares, R4, closed circles, R16; closed triangles, R23. Fitted functions: dotted line, LNCaP; dashed line, empty vector-transfected cells; solid line, ribozyme-transfected cells.

