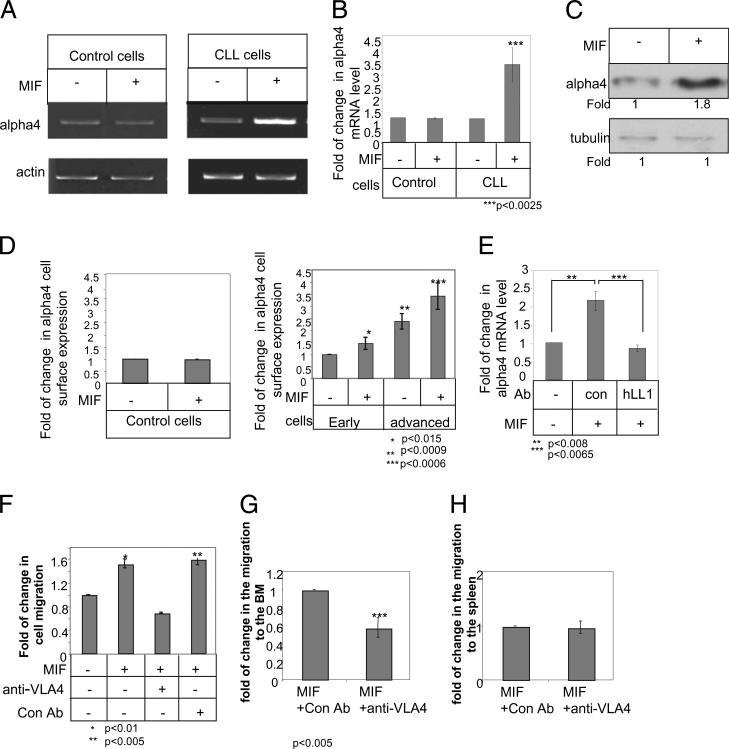
FIGURE 4.
MIF upregulates VLA-4 expression that is essential for homing of CLL cells to the BM. A–D, B cells derived from healthy individuals (control) or CLL patients were purified. Cells were incubated in the presence or absence of MIF. A and B, After 18 h, RNA was purified. A, α4 and actin mRNA were analyzed by PCR. n = 8 patients. B, Quantitative RT-PCR: results are expressed as a fold change in α4 expression in stimulated cells compared with nonstimulated cells, which was defined as 1. Results shown are a summary of two controls and three CLL patients. C and D, Cells were lysed after 24 h. C, α4 integrin and tubulin were analyzed by Western blot analysis. n = 4 patients. D, Cells were stained with anti–VLA-4 and analyzed by FACS. The graph shows the average VLA-4 expression on 6 advanced and 10 early CLL patients. E, CLL cells were incubated in the presence or absence of MIF, hLL1, or a control Ab. After 18 h, RNA was purified. Quantitative RT-PCR: results are expressed as a fold change in α4 expression by stimulated cells compared with nonstimulated cells, which was defined as 1. Results shown are a summary of three separate experiments. F–H, Advanced cells were incubated with MIF for 24 h and then with anti–VLA-4 for 30 min. F, Cell migration toward CXCL12 was analyzed on a Transwell plate coated with fibronectin for 3 h. The graph shows a single experiment, representative of four. G and H, Cells were stained with CFSE and were injected i.v. into C57BL/6 mice for 3 h. BM (G) and spleen (H) populations were analyzed by FACS. The graph shows an average of three advanced CLL patients.

