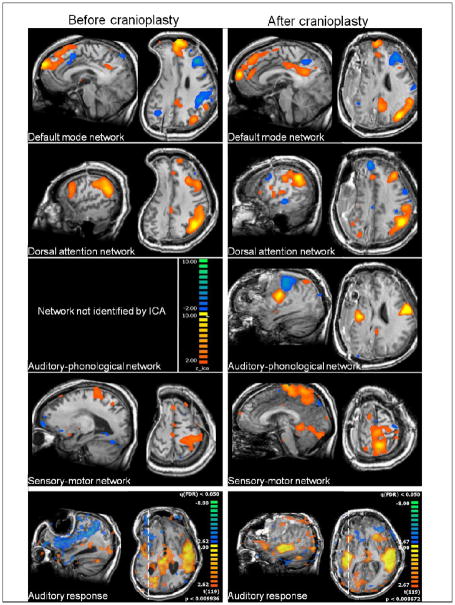
FIGURE 1.
Top four rows: Resting state networks before (left column) and after (right column) cranioplasty. The auditory-phonological network could not be identified by independent component analysis (ICA) before cranioplasty and emerges only post-surgery. Colors denote z-values for the independent components as shown on the scale in the third row on the left.
Bottom row: Auditory responses to stimulation with short spoken sentences before (left) and after (right) cranioplasty. Before cranioplasty, auditory response is absent on the ipsilateral side and restored after cranioplasty. Colors denote z-values of the general linear model used to fit the response. The threshold is defined as a false discovery rate of the multiple test problem of p = 0.05. Dashed lines on the axial cuts denote the position of the corresponding sagittal images. Axial cuts are shown in radiological convention in which the right side of the brain is shown on the left side of the image.

