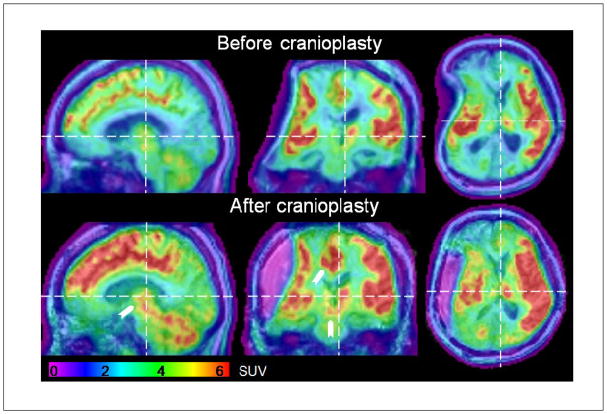
FIGURE 2.
FDG-PET images before and after cranioplasty overlaid onto anatomical MRI images. Color codes standard uptake values (SUVs) in units of g/ml as shown in the color bar at the bottom of the panel and arrows point towards changes in mesodiencephalic and mesial cortical regions. Dashed lines mark the position of the corresponding other cuts. Axial and coronal cuts are shown in radiological convention.

