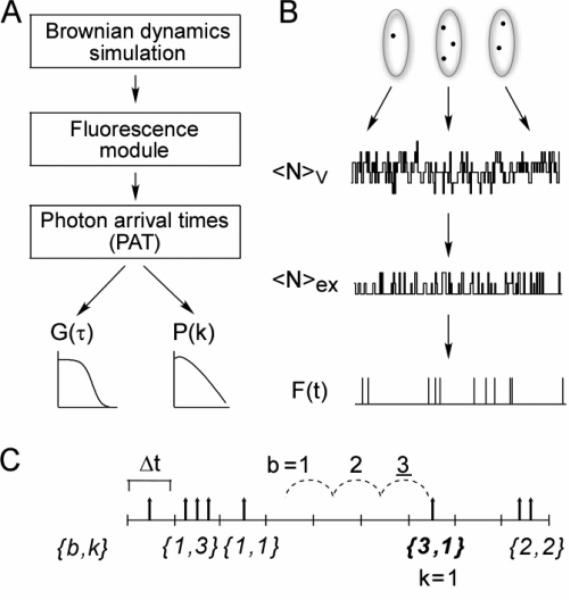
Figure 1.
Simulation method. (A) Simulations were done in three steps: computation of Brownian dynamics trajectories using GROMACS software; computation of fluorescence time courses using custom software; and computation of correlation functions and photon-count histograms from photon arrival times. (B) Brownian dynamics trajectories were generated to give coordinates of a collection of molecules in a periodic box. The number of molecules within a subvolume of the box at each time, NV, was computed. A fraction of these molecules, Nex, were excited, and a fraction of the excited molecules emitted photons, generating a fluorescence time course, F(t). (C) Photon arrival time format. Given a user-defined time bin, Δt, fluorescence photon counts are stored as a data pair: the first element is the number of empty bins, b, separating bins containing photons, and the second element is the number of photons, k, within the latter bin. Shown in the figure is the entry 3,1. The dashed lines demonstrate that b = 3, and the single photon at the end of the dashed lines indicates k = 1, forming the entry 3,1.

