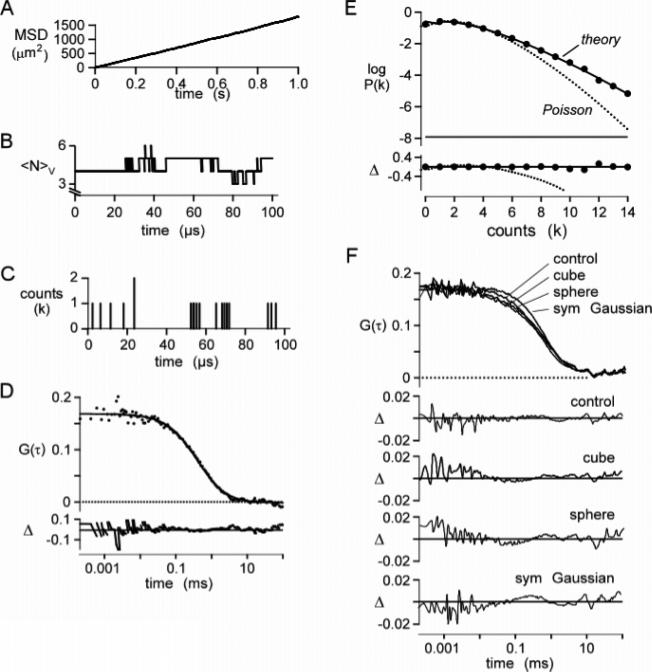
Figure 2.
Validation of simulation method. The Brownian dynamics simulation of particle diffusion was run for 1 s using a 200 ns time step for 1000 molecules with a diffusion coefficient of 300 μm2/s in a 10 × 10 × 10 μm3 box (average concentration 1 particle/μm3; 1.7 nM). (A) Mean-square displacement plot of particle positions. The fitted slope gives a diffusion coefficient of 298 μm2/s. (B) Representative plot of the number of particles, NV, in a 1 × 1 × 3 μm3 cubic observation volume. (C) Corresponding plot for detected photons. Molecules were excited with a Gaussian excitation profile of wxy = 0.354 μm, wz = 1.061 μm (κ = 3), and specific brightness 17 kHz/molecule. (D) Autocorrelation function, G(τ), computed from F(t) from four separate simulations. The solid line is fitted G(τ) for a simple diffusion (eq 9) (see text for fitted parameters), with fractional deviation (Δ) shown in the lower panel. (E) Photon-count histogram, P(k;ΔT), generated from the fluorescence trace with ΔT = 20 μs. Data were fitted with the P(k;ΔT) for the Poisson distribution (dotted curve) and the super-Poissonian model (theory; solid curve) (Chen et al.12). (F) Effect of the excitation profile on G(τ). Trajectories were generated as above. The fluorescence module was modified to produce cubic, spherical, and symmetric Gaussian (ωx = ωy = ωz) excitation profiles. Simulated data were fitted with eq 9, and the fractional deviation between fit and simulation (Δ) was plotted.

