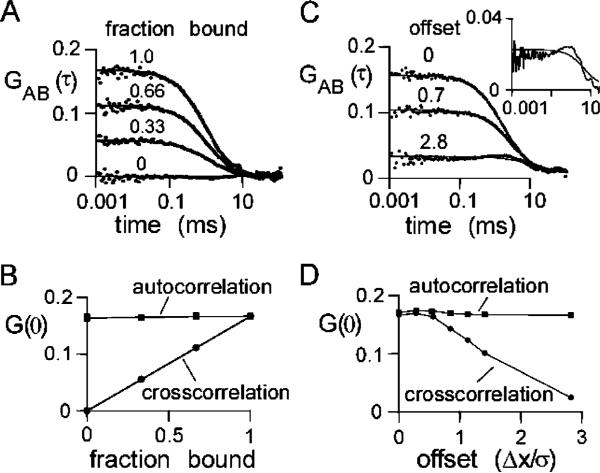
Figure 5.
Simulations of TCFCS. Brownian dynamics trajectories (1 s) generated for 192 spherical particles of type A and 192 spherical particles of type B (each with a diffusion coefficient of 273 μm2/s) in a 4 × 4 × 12 μm3 box using a step time of 100 ns for 107 steps. F(t) generated using a Gaussian excitation beam (wxy = 0.354 μm and wz = 1.061 μm) and a specific brightness of 17 kHz/molecule. (A) Effect of dimer formation on the cross-correlation function. Indicated fractions of A and B were constrained as 50 nm rigid-rod A–B dimers. Solid lines are a fit of eq 9. Fitted parameters: G(0) = 0.055, 0.112, and 0.165 and τD = 0.97, 0.97, and 0.83 ms for bound fractions 0.33, 0.66, and 1.00, respectively. For unbound A and B, G(0) = 0.163 and τD = 0.42 ms (data not shown). (B) Dependence of G(0) on fraction bound. The autocorrelation of the A molecules, GAA(0), is shown. GBB(0) (not shown) was identical to GAA(0). (C) Effect of beam misalignment on cross-correlation function. A and B were constrained as 50 nm rigid-rod A–B dimers. Illumination and detection profiles for A and B were displaced in the x-direction by indicated distances. The solid lines represent a fit of eq 9 to the data. Fitted parameters: G(0) = 0.158, 0.102, and 0.026 and τD = 1.63, 1.38, and 5.96 μs for offset Δx/σ = 0.0, 0.7, and 2.8, respectively. Δx is the offset of the centers of the Gaussian excitation profiles, and σ is the standard deviation in the x-direction. The inset shows the lower curve on an expanded y-scale. (D) Effect of misalignment of the beams on auto- and cross-correlation G(0).

