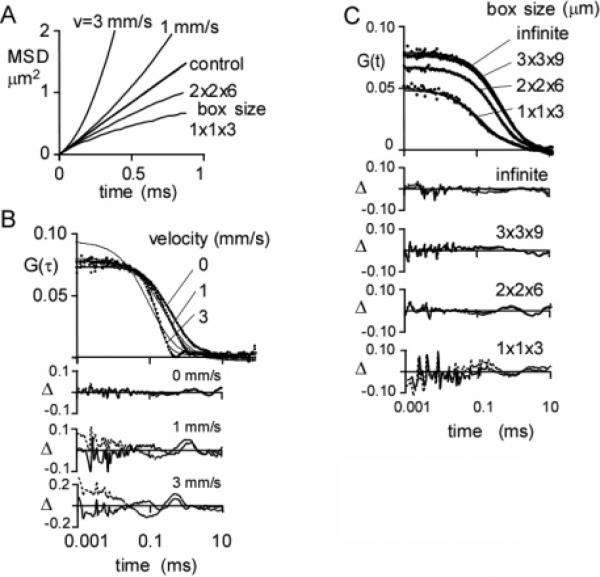
Figure 7.
Simulations of anomalous diffusion. (A) MSD plots for simulated super- and subdiffusion. Brownian dynamics trajectories were generated for 0.73 μm particles at a concentration of 2 particles/μm3 for 100 ms using a 200 ns time step (average of 50 trajectories). Superdiffusion was simulated by a constant velocity (v) in the x-direction. Subdiffusion was simulated by confining the particle to a rectangular box of indicated dimensions. (B) Superdiffusion. F(t) values were generated with a Gaussian excitation profile of wxy = 0.354 μm, wz = 1.061 μm (κ = 3), and a specific brightness of 17 kHz/molecule. G(τ) as a function of velocity is shown along with deviations (Δ) between the fit of eq 9 (dashed line) or 11 (solid line) and the simulation. Fitted parameters are given in Table 1. (C) Subdiffusion. F(t) and fits were generated as in part B. Infinite box size refers to a 3 × 3 × 9 μm3 box with periodic boundary conditions.

