Figure 5.
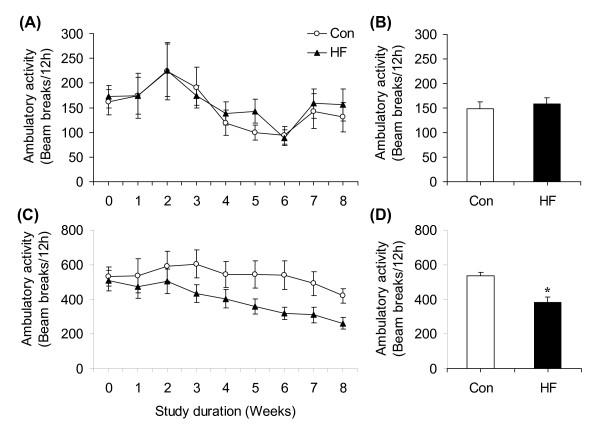
Time-course profile of average light cycle (A) and dark cycle (C) daily ambulatory activity of rats either fed standard chow (control, Con) or high-fat (HF) diet for 8 weeks. Bar graphs represent average ambulatory activity over the 8-week dietary-intervention-period during the light (B) and dark (D) cycles. *P < 0.05 vs. Con. N = 12.

