
Figure 1.
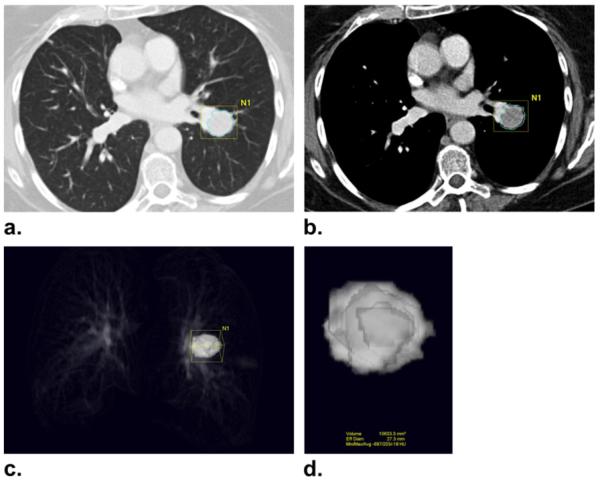
Computed tomography (CT) tumor volume measurement in a 73-year-old female with advanced non-small cell lung cancer. (a, b) CT scan of the chest in a patient with advanced lung cancer demonstrates a lung lesion abutting the pulmonary vasculature. Clicking a voxel within a lesion allows the software to automatically segment the lesion using adaptive threshold and size criteria, and the boundary of the segmented lesion is displayed on the CT images. The boundary of the tumor is adjusted manually by the radiologist on each image to separate the lesion and adjacent vasculature. (c, d) The segmented tumor is displayed in a three-dimensional fashion, and the volume and CT attenuation coefficient (Hounsfield units) of the segmented tumor are provided.