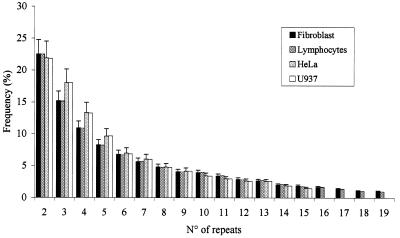
Figure 4.
Size distribution of G-rich 3′ overhangs in four human cell types. The percentages of G-rich tails of different lengths are reported for fibroblasts, lymphocytes, HeLa and U937 cells. The frequency of overhangs of different length is obtained by normalizing the intensity of each single band to the sum of intensity of all the bands of the ladder. On the x-axis the number of oligonucleotides ligated by the OLA are reported.

