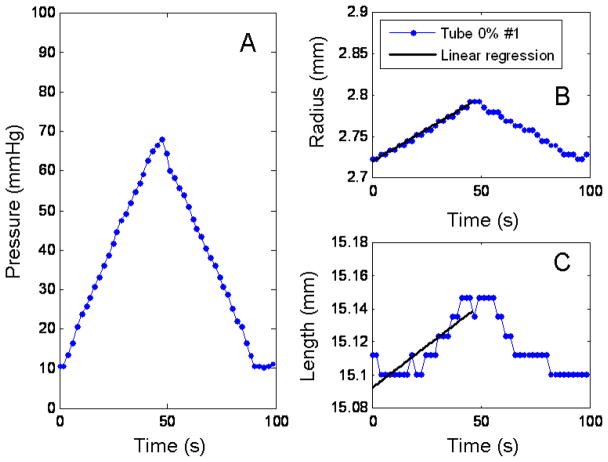
Fig. 3.
Diameter and length response to a pressurization loop for the 0%#1 urethane tube. Panel A shows the pressure profile going into the tube. Panel B is the response of the diameter to the pressure. Panel C, the response of the length to the pressure. The solid lines in panels B and C are the linear regression of the pressurization data.

