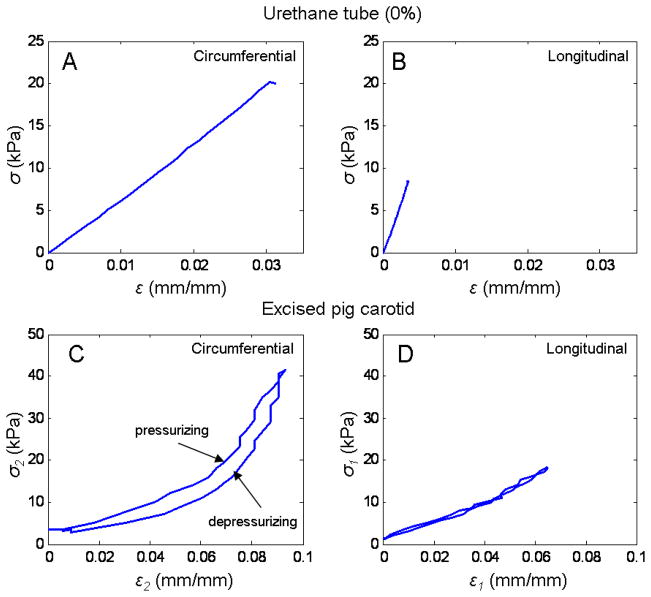
Fig. 5.
Strain-stress relationships for tube (0%#1) and artery (right carotid artery pig 1). Panel A shows the strain-stress relationship for the urethane tube in the circumferential direction. Panel B, in the longitudinal direction. In the tube since there was no hysteresis, only the calculated values for the stresses and strains from the linear regression during pressurization are shown. Panel C and D, show the relationships between strain and stresses for the excise right pig 1 carotid artery in the circumferential and longitudinal directions, respectively.

