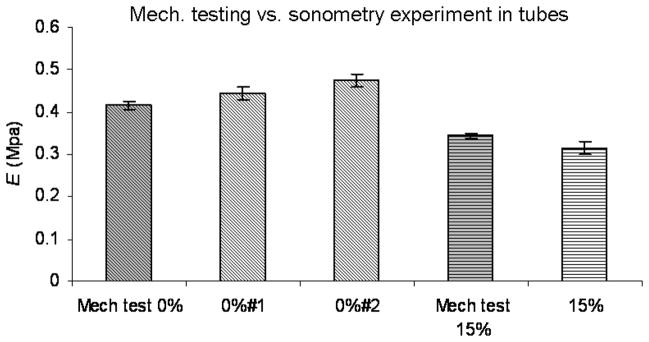
Fig. 7.
Comparison between the sonometry results in urethane tubes and mechanical testing. First column is the Young’s modulus for the 0% soflex urethane samples. Column 2 and 3 the results for tubes 0%#1 and 0%#2, respectively, with sonometry. Column 4 is the mechanical testing results on the 15% soflex urethane samples. Column 5 is the sonometry results on the 15% tube. The error bars for the mechanical testing represent the standard deviation of the results from 5 different samples of the same material. The error bars for the sonometry results represent the standard deviation of the results from 3 consecutive pressurization loops.

