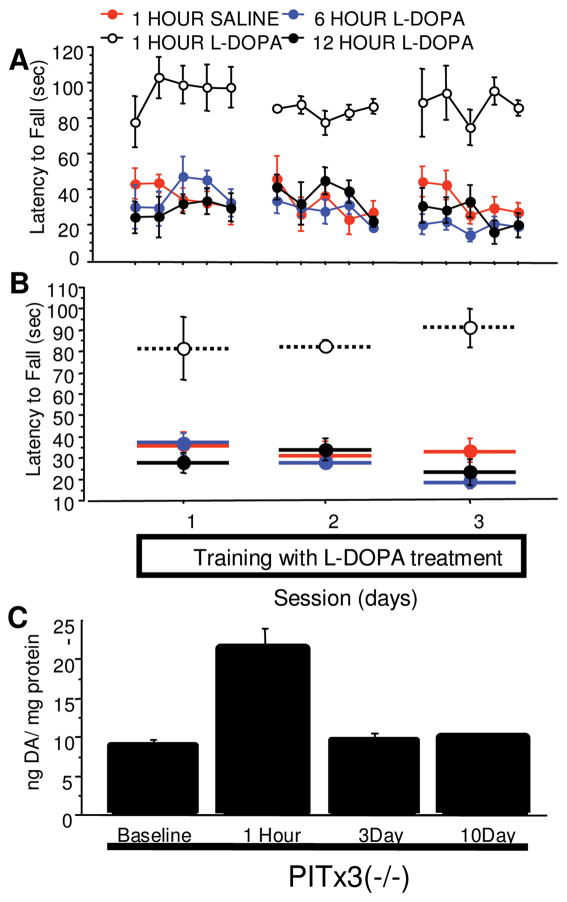
FIGURE 4.
Time-course of L-dopa treatment effects. PITx3(−/−) mice were given L-dopa or saline injections at different time points (1 hour, 6 hours, or 12 hours) before training for 3 days. (A) Latency to fall in each trial. (B) Average latency to fall during each session (n = 6 per treatment). (C) Dopamine (DA) content in dorsal striatum of L-dopa–naive PITx3(−/−) animals, PITx3(−/−) animals receiving an acute L-dopa injection (1 hour prior to sample collection), and PITx3(−/−) animals receiving chronic L-dopa treatment for 7 days and treatment cessation for either 3 or 10 days. n = 6 per treatment.

